प्रायोगिक अवधि में नि:शुल्क Vpn security and cloud data analysis represented through visual metaphors cloud shield with vpn text and graph represent vpn security and cloud data analysis represented through visual metaphors cloud shield with vpn text and graph represent.
प्रायोगिक अवधि में नि:शुल्क Global connectivity and data analysis concept with modern work environment globe line graph blue points minimal chair highlight global connectivity and data analysis concept with modern work environment globe line graph blue points minimal chair highlight.
प्रायोगिक अवधि में नि:शुल्क Exploring cryptocurrency transactions wallets graphs and exchange dynamics digital wallet bitcoin symbol exchange arrows graph exploring cryptocurrency transactions wallets graphs and exchange dynamics digital wallet bitcoin symbol exchange arrows graph.
प्रायोगिक अवधि में नि:शुल्क Magnifying glass money bag with dollar sign and fluctuating growth graph ideal for finance economic research investment strategies magnifying glass money bag with dollar sign and fluctuating growth graph ideal for finance economic research investment strategies.
प्रायोगिक अवधि में नि:शुल्क पारदर्शी पृष्ठभूमि पर हाइलाइटर का वेक्टर चित्रण। प्रीमियम गुणवत्ता प्रतीक। अवधारणा और ग्राफिक डिजाइन के लिए लाइन कलर वेक्टर आइकन. हाइलाइटर, स्थायी, स्टेशनरी, रेखांकित. पारदर्शी पृष्ठभूमि पर हाइलाइटर का वेक्टर चित्रण। प्रीमियम गुणवत्ता प्रतीक। अवधारणा और ग्राफिक डिजाइन के लिए लाइन कलर वेक्टर आइकन
प्रायोगिक अवधि में नि:शुल्क Webpage layout with various content blocks and a large percentage sign ideal for web analytics ui design metric visualization webpage layout with various content blocks and a large percentage sign ideal for web analytics ui design metric visualization.
प्रायोगिक अवधि में नि:शुल्क Renewable energy in urban living sustainability and technology in smart cities urban skyline with solar panels graph circular renewable energy in urban living sustainability and technology in smart cities urban skyline with solar panels graph circular.
प्रायोगिक अवधि में नि:शुल्क Analytical graphs and global data concepts for statistical business insights grid sine curve on cartesian plane line graph ideal analytical graphs and global data concepts for statistical business insights grid sine curve on cartesian plane line graph ideal.
प्रायोगिक अवधि में नि:शुल्क Scales with money and home elements graph teacher pointing to paper ideal for finance personal growth education work life balance scales with money and home elements graph teacher pointing to paper ideal for finance personal growth education work life balance.
प्रायोगिक अवधि में नि:शुल्क डिजिटल स्कोरबोर्ड आइकन। फुटबॉल मैच के परिणामों का प्रदर्शन। खेल स्टेडियम स्कोर तालिका वेक्टर चित्रण. इलेक्ट्रॉनिक स्कोरबोर्ड जो पेशेवर फुटबॉल मैचों और खेल आयोजनों के लिए टीमों के स्कोर दिखाता है. डिजिटल स्कोरबोर्ड आइकन। फुटबॉल मैच के परिणामों का प्रदर्शन। खेल स्टेडियम स्कोर तालिका वेक्टर चित्रण
प्रायोगिक अवधि में नि:शुल्क Navigating real estate market trends through data analysis and financial growth house outline investment graph with blue trend navigating real estate market trends through data analysis and financial growth house outline investment graph with blue trend.
प्रायोगिक अवधि में नि:शुल्क Data analysis and personal growth symbolized by graph arrow and professional figure circle user icon professional figure graph data analysis and personal growth symbolized by graph arrow and professional figure circle user icon professional figure graph.
प्रायोगिक अवधि में नि:शुल्क Cloud driven financial growth data analysis market trends and economic strategy with graph blue points descending dollar coin cloud driven financial growth data analysis market trends and economic strategy with graph blue points descending dollar coin.
प्रायोगिक अवधि में नि:शुल्क Blue award ribbon and statistical graph representing success and achievement metrics blue award ribbon with checkmark line graph blue award ribbon and statistical graph representing success and achievement metrics blue award ribbon with checkmark line graph.
प्रायोगिक अवधि में नि:शुल्क Coins stacked alongside bar and line graphs ideal for finance investment economics business strategy analytics data visualization coins stacked alongside bar and line graphs ideal for finance investment economics business strategy analytics data visualization.
प्रायोगिक अवधि में नि:शुल्क Cartoon webpage display screen with pie chart analysis presented by arrow and list illustration for online business presentation cartoon webpage display screen with pie chart analysis presented by arrow and list illustration for online business presentation.
प्रायोगिक अवधि में नि:शुल्क Seo optimization with trend analysis for e commerce success text t shirt outline graph line cloud ideal digital marketing data seo optimization with trend analysis for e commerce success text t shirt outline graph line cloud ideal digital marketing data.
प्रायोगिक अवधि में नि:शुल्क Economic trends and ai influence in modern financial systems depicting currency as coin ai brain and graph ideal for tech finance economic trends and ai influence in modern financial systems depicting currency as coin ai brain and graph ideal for tech finance.
प्रायोगिक अवधि में नि:शुल्क Financial growth and analytics data insights economic trends for strategic decision making dollar sign line chart bar with target financial growth and analytics data insights economic trends for strategic decision making dollar sign line chart bar with target.
प्रायोगिक अवधि में नि:शुल्क Graphs blue heart and cloud symbolize data analysis technology trends health connection innovation ideal for tech wellness big graphs blue heart and cloud symbolize data analysis technology trends health connection innovation ideal for tech wellness big.
प्रायोगिक अवधि में नि:शुल्क Graph with fluctuating curve and data points set beside interlocking gear wheels ideal for data analysis trends optimization graph with fluctuating curve and data points set beside interlocking gear wheels ideal for data analysis trends optimization.
प्रायोगिक अवधि में नि:शुल्क Apparel industry growth percentage analysis trends and teamwork t shirt silhouette blue symbol black line graph cog with people apparel industry growth percentage analysis trends and teamwork t shirt silhouette blue symbol black line graph cog with people.
प्रायोगिक अवधि में नि:शुल्क Creative workspace balancing art analytics and digital engagement pencil graph figure with tablet capture art data analysis creative workspace balancing art analytics and digital engagement pencil graph figure with tablet capture art data analysis.
प्रायोगिक अवधि में नि:शुल्क Abstract visualization of data flow in technological network with graphs and cityscape elements geometric shapes connect in abstract visualization of data flow in technological network with graphs and cityscape elements geometric shapes connect in.
प्रायोगिक अवधि में नि:शुल्क सफेद और काले रंगों में गोलाकार पाई चार्ट आउटलाइन आइकन। वेब, मोबाइल ऐप्स और UI के लिए बिजनेस कलेक्शन से गोलाकार पाई चार्ट फ्लैट वेक्टर आइकन सफेद और काले रंगों में गोलाकार पाई चार्ट आउटलाइन आइकन। वेब के लिए बिजनेस कलेक्शन से गोलाकार पाई चार्ट फ्लैट वेक्टर आइकन
प्रायोगिक अवधि में नि:शुल्क Conceptualizing free access global connectivity and data analytics word free global network of people line graph with data points conceptualizing free access global connectivity and data analytics word free global network of people line graph with data points.
प्रायोगिक अवधि में नि:शुल्क Effective planning understanding data trends for strategic success calendar with date rising graph person analyzing magnifying effective planning understanding data trends for strategic success calendar with date rising graph person analyzing magnifying.
प्रायोगिक अवधि में नि:शुल्क Understanding lung health through data analysis and technical tools lungs with bronchial tree data graph with points and wrench understanding lung health through data analysis and technical tools lungs with bronchial tree data graph with points and wrench.
प्रायोगिक अवधि में नि:शुल्क Securing digital analytics data protection and performance insights lightning bolt line graph with data points shield with lock securing digital analytics data protection and performance insights lightning bolt line graph with data points shield with lock.
प्रायोगिक अवधि में नि:शुल्क Data analytics and location tracking blue graph with map pin symbol graph with fluctuating data points and large blue map pin data analytics and location tracking blue graph with map pin symbol graph with fluctuating data points and large blue map pin.
प्रायोगिक अवधि में नि:शुल्क Blue arrows data graph brain icon ideal for innovation analysis strategic thinking technology integration progress decision making blue arrows data graph brain icon ideal for innovation analysis strategic thinking technology integration progress decision making.
प्रायोगिक अवधि में नि:शुल्क Cartoon bar chart illustrating growing data trends on a white background graphic representation for presentations and reports cartoon bar chart illustrating growing data trends on a white background graphic representation for presentations and reports.
प्रायोगिक अवधि में नि:शुल्क Computer monitor with web v elements data chart human profile heart and brain icons ideal for technology analysis innovation computer monitor with web v elements data chart human profile heart and brain icons ideal for technology analysis innovation.
प्रायोगिक अवधि में नि:शुल्क सफेद और काले रंगों में सर्कुलर चार्ट आउटलाइन आइकन। बिजनेस और एनालिटिक्स कलेक्शन से सर्कुलर चार्ट फ्लैट वेक्टर आइकन वेब, मोबाइल ऐप्स और UI के लिए सफेद और काले रंगों में सर्कुलर चार्ट आउटलाइन आइकन। बिजनेस और एनालिटिक्स कलेक्शन से सर्कुलर चार्ट फ्लैट वेक्टर आइकन
प्रायोगिक अवधि में नि:शुल्क इन्फोग्राफिक डिज़ाइन बिजनेस कॉन्सेप्ट वेक्टर चित्रण जिसमें 9 चरण या विकल्प या प्रक्रियाएं हैं जो कार्यप्रवाह या आरेख या वेब बटन बैनर का प्रतिनिधित्व करती हैं. इन्फोग्राफिक डिज़ाइन बिजनेस कॉन्सेप्ट वेक्टर चित्रण जिसमें 9 चरण या विकल्प या प्रक्रियाएं हैं जो कार्यप्रवाह या आरेख या वेब का प्र. इन्फोग्राफिक डिज़ाइन बिजनेस कॉन्सेप्ट वेक्टर चित्रण जिसमें 9 चरण या विकल्प या प्रक्रियाएं हैं जो कार्यप्रवाह या आरेख या वेब बटन बैनर का प्रतिनिधित्व करती हैं
प्रायोगिक अवधि में नि:शुल्क Gear icon with line graph symbolizing data optimization and analysis gear symbol graph with line and points signify industry gear icon with line graph symbolizing data optimization and analysis gear symbol graph with line and points signify industry.
प्रायोगिक अवधि में नि:शुल्क Globe with arrows medicine bottle graph blue dots highlight global health trends and data analysis ideal for healthcare research globe with arrows medicine bottle graph blue dots highlight global health trends and data analysis ideal for healthcare research.
प्रायोगिक अवधि में नि:शुल्क Planning and growth travel tickets potted plant and business trends graph travel tickets potted plant data graph with trend line planning and growth travel tickets potted plant and business trends graph travel tickets potted plant data graph with trend line.
प्रायोगिक अवधि में नि:शुल्क Curved lines a line graph blue plot points gears ideal for data analysis technology innovation progress efficiency cloud computing curved lines a line graph blue plot points gears ideal for data analysis technology innovation progress efficiency cloud computing.
प्रायोगिक अवधि में नि:शुल्क Unlocking data insights and security with analytics visualization tools padlock pen line graph blue points highlight cybersecurity unlocking data insights and security with analytics visualization tools padlock pen line graph blue points highlight cybersecurity.
प्रायोगिक अवधि में नि:शुल्क Cloud lock and graph emphasize secure data analysis in digital environments ideal for cyber security protection computing cloud lock and graph emphasize secure data analysis in digital environments ideal for cyber security protection computing.
प्रायोगिक अवधि में नि:शुल्क Cloud and raindrop symbolizing weather data analysis with graph insights cloud line graph raindrop illustrate weather analysis and cloud and raindrop symbolizing weather data analysis with graph insights cloud line graph raindrop illustrate weather analysis and.
प्रायोगिक अवधि में नि:शुल्क Triangle with exclamation mark checklist and graph highlight risk management ideal for analysis caution improvements organization triangle with exclamation mark checklist and graph highlight risk management ideal for analysis caution improvements organization.
प्रायोगिक अवधि में नि:शुल्क Car chart and brick wall exploring barriers and growth in transportation data brick wall car silhouette line chart with data car chart and brick wall exploring barriers and growth in transportation data brick wall car silhouette line chart with data.
प्रायोगिक अवधि में नि:शुल्क Data analytics and healthcare connection with cloud computing integration cloud with data graph and stethoscope outlines data analytics and healthcare connection with cloud computing integration cloud with data graph and stethoscope outlines.
प्रायोगिक अवधि में नि:शुल्क Laptop shop with online storefront delivery box graph under cloud ideal for e commerce cloud computing data analysis business laptop shop with online storefront delivery box graph under cloud ideal for e commerce cloud computing data analysis business.
प्रायोगिक अवधि में नि:शुल्क Strategic insights technology chess and data analytics for smart decisions laptop chess pawn graph with blue data points ideal for strategic insights technology chess and data analytics for smart decisions laptop chess pawn graph with blue data points ideal for.
प्रायोगिक अवधि में नि:शुल्क Interconnected growth puzzle pieces aligning with rising graph for success puzzle pieces connection upward graph trend blue arrow interconnected growth puzzle pieces aligning with rising graph for success puzzle pieces connection upward graph trend blue arrow.
प्रायोगिक अवधि में नि:शुल्क Blue play button and live text graph with data points ideal for media broadcast technology analytics communication growth blue play button and live text graph with data points ideal for media broadcast technology analytics communication growth.
प्रायोगिक अवधि में नि:शुल्क Analyzing shoe trends a visual guide to product popularity and market data woman pointing at graph with line chart large outline analyzing shoe trends a visual guide to product popularity and market data woman pointing at graph with line chart large outline.
प्रायोगिक अवधि में नि:शुल्क Cloud based housing data analytics integrating home insights with cloud computing house cloud and graph emphasize connectivity cloud based housing data analytics integrating home insights with cloud computing house cloud and graph emphasize connectivity.
प्रायोगिक अवधि में नि:शुल्क Books graph with data points blue heart speech bubble ideal for education analysis social media knowledge communication digital books graph with data points blue heart speech bubble ideal for education analysis social media knowledge communication digital.
प्रायोगिक अवधि में नि:शुल्क Black play button profile id card and line graph ideal for media analytics storytelling technology data communication online black play button profile id card and line graph ideal for media analytics storytelling technology data communication online.
प्रायोगिक अवधि में नि:शुल्क Microphone beside graph under cloud ideal for technology computing data analysis voice recognition ai innovation communication microphone beside graph under cloud ideal for technology computing data analysis voice recognition ai innovation communication.
प्रायोगिक अवधि में नि:शुल्क Digital creativity the intersection of art and technology in modern recording person pointing with blue shirted arm recording icon digital creativity the intersection of art and technology in modern recording person pointing with blue shirted arm recording icon.
प्रायोगिक अवधि में नि:शुल्क Blue shield with gdpr text stars secure lock location marker and line graph ideal for data protection privacy regulation blue shield with gdpr text stars secure lock location marker and line graph ideal for data protection privacy regulation.
प्रायोगिक अवधि में नि:शुल्क Modern data analysis and virtual interaction symbolized with graphs and vr headset abstract landscape line graph with data points modern data analysis and virtual interaction symbolized with graphs and vr headset abstract landscape line graph with data points.
प्रायोगिक अवधि में नि:शुल्क E commerce growth and analysis online storefront with sales data visualization graph with rising trend online shopping page with e commerce growth and analysis online storefront with sales data visualization graph with rising trend online shopping page with.
प्रायोगिक अवधि में नि:शुल्क Business growth and environmental strategy through data analysis sustainability man in blue shirt with laptop chart nodes abstract business growth and environmental strategy through data analysis sustainability man in blue shirt with laptop chart nodes abstract.
प्रायोगिक अवधि में नि:शुल्क Laptop graph with data points person in blue suit pointing ideal for business analysis strategy growth analytics technology laptop graph with data points person in blue suit pointing ideal for business analysis strategy growth analytics technology.
प्रायोगिक अवधि में नि:शुल्क Credit card with emv chip percentage symbol and line graph ideal for finance banking budgeting investment savings interest rates credit card with emv chip percentage symbol and line graph ideal for finance banking budgeting investment savings interest rates.
प्रायोगिक अवधि में नि:शुल्क काले पाई चार्ट आइकन। गोलाकार फ्लैट आरेख। सरल इन्फोग्राफिक तत्व। वेक्टर। काले पाई चार्ट आइकन
प्रायोगिक अवधि में नि:शुल्क वृत्ताकार फ्लैट आरेख। सरल इन्फोग्राफिक तत्व। वेक्टर. काले पाई चार्ट आइकन. वृत्ताकार फ्लैट आरेख। सरल इन्फोग्राफिक तत्व। वेक्टर
प्रायोगिक अवधि में नि:शुल्क काले पाई चार्ट आइकन। वृत्ताकार फ्लैट आरेख। सरल इन्फोग्राफिक तत्व। वेक्टर काले पाई चार्ट आइकन। वृत्ताकार फ्लैट आरेख। सरल इन्फोग्राफिक तत्व। वेक्टर
प्रायोगिक अवधि में नि:शुल्क वृत्ताकार फ्लैट आरेख। सरल इन्फोग्राफिक तत्व। वेक्टर. काले पाई चार्ट आइकन. वृत्ताकार फ्लैट आरेख। सरल इन्फोग्राफिक तत्व। वेक्टर
प्रायोगिक अवधि में नि:शुल्क काले पाई चार्ट आइकन। गोलाकार फ्लैट आरेख। सरल इन्फोग्राफिक तत्व। वेक्टर। काले पाई चार्ट आइकन
प्रायोगिक अवधि में नि:शुल्क वृत्ताकार फ्लैट आरेख। सरल इन्फोग्राफिक तत्व। वेक्टर. काले पाई चार्ट आइकन. वृत्ताकार फ्लैट आरेख। सरल इन्फोग्राफिक तत्व। वेक्टर
प्रायोगिक अवधि में नि:शुल्क Digital media insights video playback and data visualization for strategic growth video player interface with progress bar hand digital media insights video playback and data visualization for strategic growth video player interface with progress bar hand.
प्रायोगिक अवधि में नि:शुल्क Earth with nodes servers line graph peak upward arrows ideal for tech analytics growth connectivity data flow globalization earth with nodes servers line graph peak upward arrows ideal for tech analytics growth connectivity data flow globalization.
प्रायोगिक अवधि में नि:शुल्क Social media engagement and data analysis visualization with graph and user interaction social media card user interacting with social media engagement and data analysis visualization with graph and user interaction social media card user interacting with.
प्रायोगिक अवधि में नि:शुल्क Digital marketing concept with magnet computer screen and line graph for data analysis magnet attracting computer screen showing digital marketing concept with magnet computer screen and line graph for data analysis magnet attracting computer screen showing.
प्रायोगिक अवधि में नि:शुल्क Global connectivity visualizing network dynamics and data analytics in a digital world nodes connected across map fluctuating global connectivity visualizing network dynamics and data analytics in a digital world nodes connected across map fluctuating.
प्रायोगिक अवधि में नि:शुल्क Industrial evolution from traditional windmills to modern factories and data analytics factory skyline windmill graph with blue industrial evolution from traditional windmills to modern factories and data analytics factory skyline windmill graph with blue.
प्रायोगिक अवधि में नि:शुल्क Eye care and health monitoring balancing technology in healthcare and emotional well being eye with blue teardrop person with eye care and health monitoring balancing technology in healthcare and emotional well being eye with blue teardrop person with.
प्रायोगिक अवधि में नि:शुल्क ग्राफ और चार्ट आइकन लाइन डिज़ाइन नीला। व्यावसायिक ग्राफ, चार्ट, डेटा, आरेख, आँकड़े, पाई चार्ट, डेटा विज़ुअलाइज़ेशन वेक्टर चित्रण। ग्राफ और चार्ट संपादन योग्य स्ट्रोक आइकन। ग्राफ और चार्ट आइकन लाइन डिज़ाइन नीला। व्यावसायिक ग्राफ, चार्ट, डेटा, आरेख, आँकड़े, पाई चार्ट, डेटा विज़ुअलाइज़ेशन
प्रायोगिक अवधि में नि:शुल्क Digital retail trends analyzing data insights and mobile interaction in modern shopping graph with upward trend smartphone hand digital retail trends analyzing data insights and mobile interaction in modern shopping graph with upward trend smartphone hand.
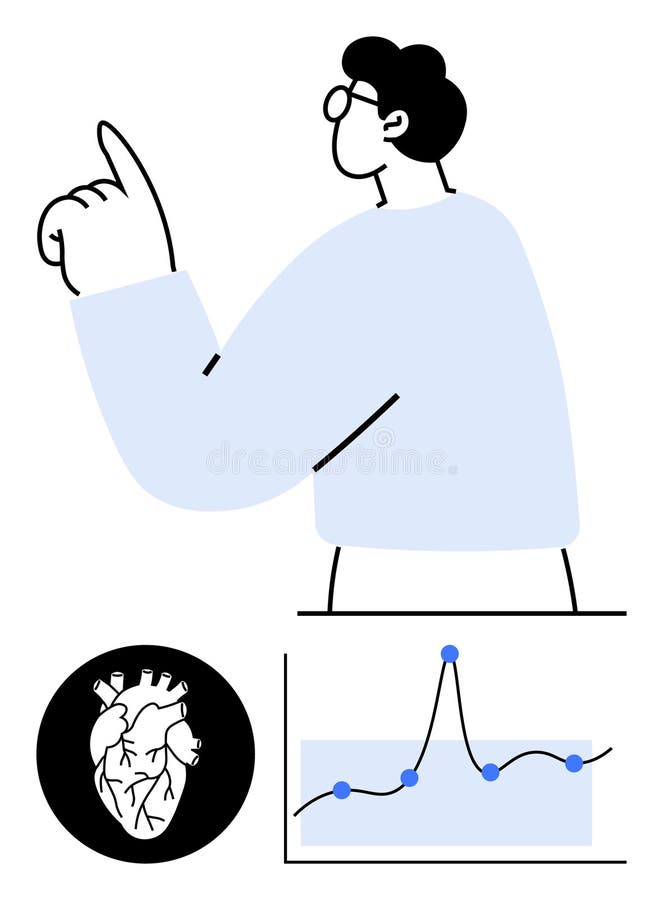
प्रायोगिक अवधि में नि:शुल्क Analyzing heart health expert insights with graphs and diagrams for better understanding professional analyzing data with stylized analyzing heart health expert insights with graphs and diagrams for better understanding professional analyzing data with stylized.
प्रायोगिक अवधि में नि:शुल्क Navigating economic trends hand gestures and financial graphs illustrate market insights hand with index finger pointing financial navigating economic trends hand gestures and financial graphs illustrate market insights hand with index finger pointing financial.
प्रायोगिक अवधि में नि:शुल्क Digital fitness journey modern health tracking through technology and data visualization woman running through smartphone screen digital fitness journey modern health tracking through technology and data visualization woman running through smartphone screen.
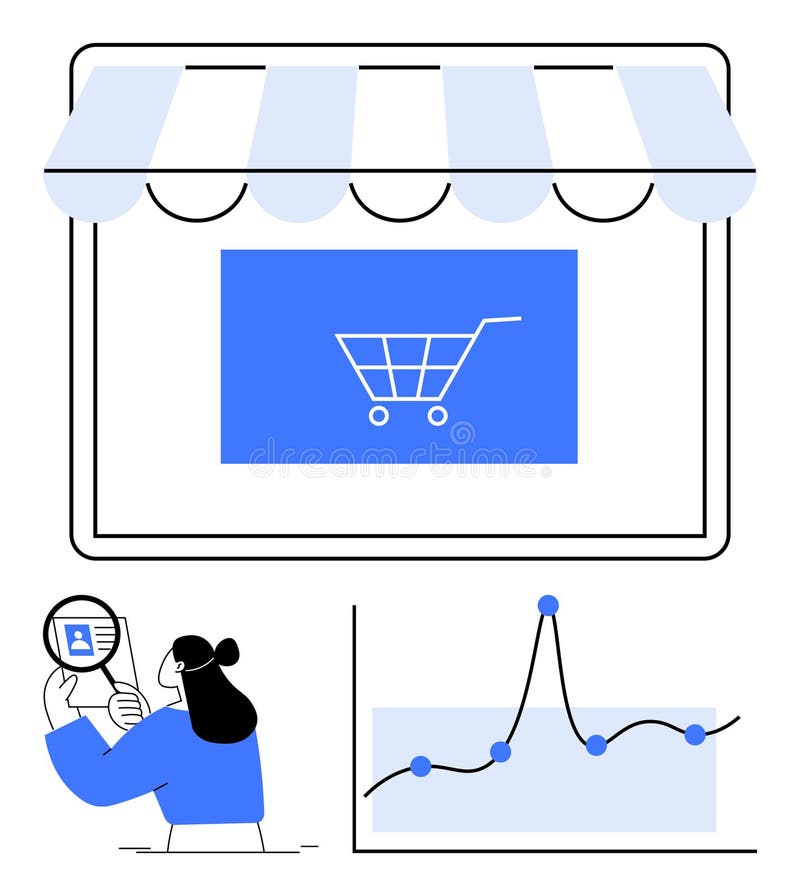
प्रायोगिक अवधि में नि:शुल्क Growth strategies in e commerce analyzing performance with digital tools and visual data shopping cart graph person magnifying growth strategies in e commerce analyzing performance with digital tools and visual data shopping cart graph person magnifying.
 साइन इन करें